Whoever you are that keeps doing websearches like these that land you on MAX FAQs…

…this post is for you.
A while back, someone over at Portland Transport jumped through the mired swamp that is TriMet’s public records request process and came out with an extremely detailed schematic of the existing and planned MAX alignment. Sample pages below:
 Blue Line at Hatfield
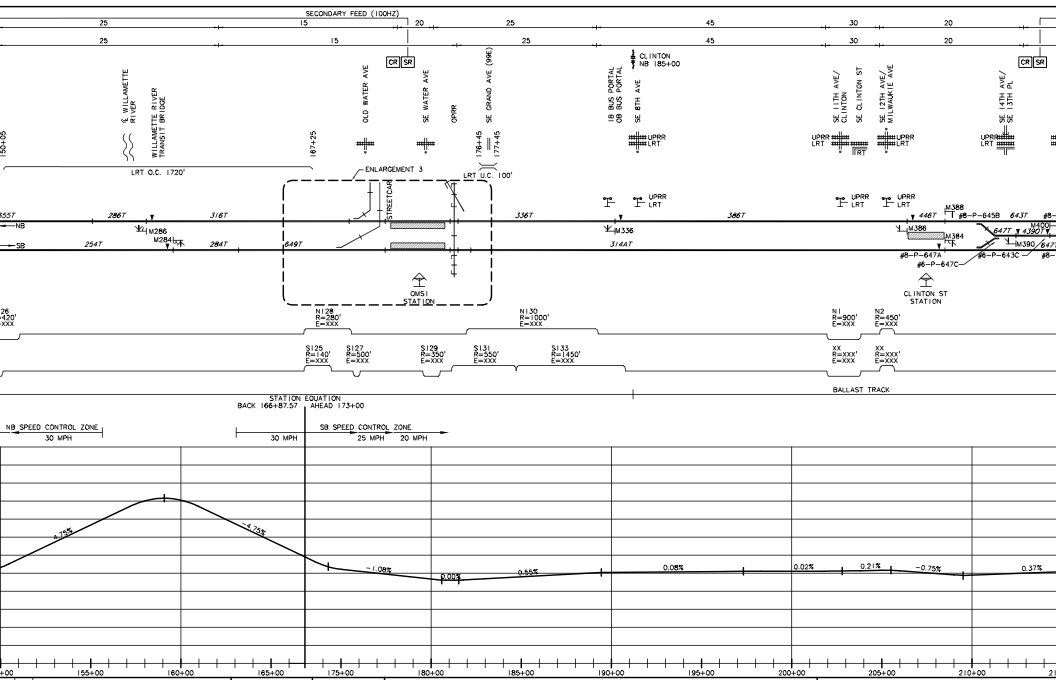 Orange Line’s new bridge, OMSI, and Clinton platforms
It’s a very thorough document that has grade/elevation/direction changes, speeds, etc (though for the person who is looking for the deepest part of the tunnel, it appears to only give elevation above sea level, not depth below the surface, and paradoxically Washington Park is the deepest underground platform and yet appears to have the highest elevation above sea level of all the platforms). This is not exactly light bathroom reading, but it’s an interesting reference for the transit wonks out there.
Anyway, have at it, folks. It’s a PDF, about 2.5 MB, and since it had already been released into the public, I figure it’s fair to repost it, especially if it saves someone money by not having to request it from TriMet again for when you just need to know how far apart the Old Town Chinatown and Rose Quarter platforms are (2700′, for the curious).


Darn, I was hoping this would answer one of my orange line questions, how will the overhead line(and Max Trains) cross OPRR’s line on New Water St? Wouldn’t the overhead wire be to low for OPRR train clearance? Will there be a break/coast zone? I’ve yet to find the answer!
That I don’t know, I’ll see what I can find. Or maybe someone else reading here would know.
A little late but:
A certain TriMet employee (but not directly involved with the project) says there will be a section of centenary that can be raised for over-height cars to cross.
THANK YOU SO MUCH ! for enabling me to find out how steep the grades are (and how sharp the curves are) at the wanna-be roller-coaster on the Airport Line approaching/ leaving the Gateway Station – now I also know it’s known as the “fishhook”. I’ve been looking for this data off and-on since I last rode it in 2004 . . . – no luck until; I stumbled across your blog a couple months ago.
FYI, it’s up on a +5.00% grade on the tangent approaching the I-84 ramps, then into a 185 ft.-long ‘summit’ vertical curve, near the peak of which a 100-ft. radius curve to the left starts, and then a -4.30% down grade into what looks like an 80 ft.-long ‘sag’ vertical sag curve to end the grade as the horizontal curve also ends just before the turnout (switch) just south of the station, where hte grade is a mere +0.167% uphill. This data is shown on page 26 of 40 of the ‘PDF’ file that you linked, which is the drawing titled “FIGX19” – “AIRPORT LINE PROFILE – Figure 2-8 – Sheet 10 of 10”.
When I rode it, the grades looked and felt much worse than that – perhaps because I was standing, and the vertical curves combine with the horizontal curve to produce some comparatively strong centripetal (centrifugal) and anti-gravitational forces at the same time.
Now all I need are some good photos or a video showing just how it looks from the ground and inside of a MAX trainset . . .
Thanks again !
Best regards,
– Paul D. North, Jr., P.E.
Allentown, PA
Thanks for reading! Here is a timelapse version (not mine) that someone posted on Youtube from Lloyd Center to the airport.